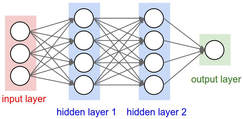
 This month I have made the most progress so far. I am definetly on track according to my timeline and actually a little further ahead than I thought I would be at this point. Since I am currently home for thanksgiving break, I enlisted the help of my older brother William. His strong background in math, computer science, and engineering was extremely helpful. As mentioned in my previous post, we used python to create a neural network which gave us a nearly exact approximation of the ENSO values for multiple months. A neural network is a computer system modeled on the human brain and nervous system. A neural network uses a large number of processors arranged in tiers. The first tier receives the raw input data, and adds a 'weight' onto it. Each successive tier receives the output from the previous tier. The last tier produces the output, which in this case, is the ESNO value. I have attached a picture I found on google images to make this clearer. The computer system we used automatically adds a weight and keeps readjusting it until it gets closer and closer to the actual value it is looking for. My last blog post shows a screenshot of that graph. Although this so far can only predict one month in advance, I am trying to figure out a way to predict further ahead. Hopefully, an entire year ahead.
1 Comment
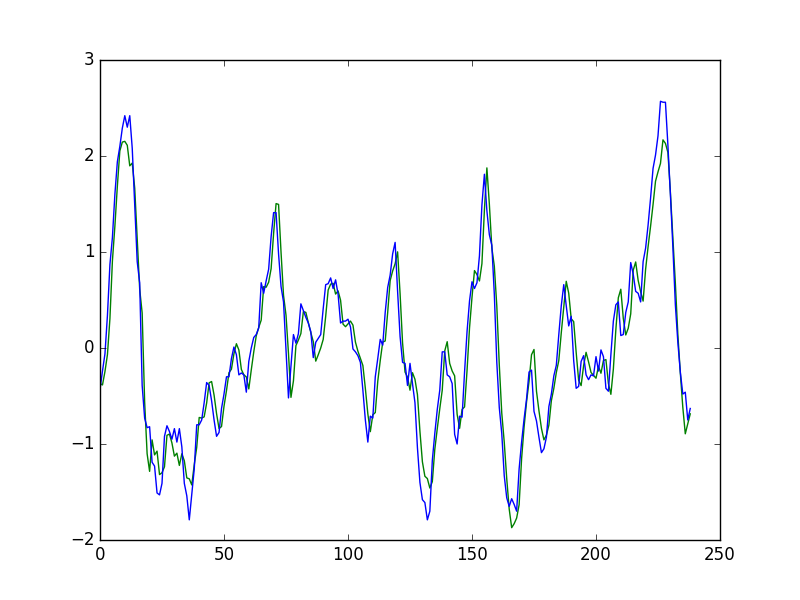 For my assignment, I decided to interview my brother, William, who is in his 3rd year at Dartmouth College. He is an engineering major, and just finished a class in Applied Machine Learning. When I explained my project to him, he immediately identified it as a problem which is well suited to be solved using recurrent neural networks. He used python to create a recurrent neural network that uses the past 24 months to predict the next months ESNO value. He walked me through how to use this software and how recurrent neural networks work (which I will explain more in my next blog post). Although this current version only predicts 1 month in advance, it is possible to adjust it to predict further ahead. However, predicting further ahead will decrease accuracy, which is not ideal. The graph which I have attached below shows predictions for 250 past months. We decided to test past months just to see how close the predicted values were to the actual values. As you can see, our prediction was incredibly close and the graphs are almost identical. I asked William what other things this type of neural network could be used to examine. I was also extremely curious in machine learning, and asked what other types of machine learning algorithms exist. William told me that this type of recurring neural network is commonly used for stock market predictions, and other instances when you want to use past experiences to predict the future. He also shared with me that there are decision trees, support vector machines, and clustering algorithms which are all different types of machine learning that have their own advantages. I hope to be able to learn more about these in the future!
The big project I did this month is starting to analyze all the data in the Nino 3.4 box. This data goes all the way back to the year 1870, so it was quite a lot to do. My mentor sent me a chart which contained all this data and wanted me to mark the occurrences of El Nino and La Nina in the file to see what the index looks like. If the data value in December was greater than 1, we considered it an El Nino year. If the data value in December was less than 1, it was considered a La Nina year. I went through all the data and highlighted all the El Nino years red and La Nina years blue. For clarity, El Nino is warmer than normal sea temperature while La Nina is cooler than normal sea temperature. After doing this, I looked for any patterns. For example, an ideal pattern would have been if every year the temperature alternated between El Nino and La Nino. Unfortunately, there was no clear pattern in this regard. This was expected, so it's not a major problem. Next, I looked at something called the spring trend.
My goals for September were to download and familiarize myself with mathematica and visit Dartmouth to meet with my mentor. I was able to achieve both of these goals! This month I was working specifically on figuring out ways to specialize my project more. For example, my mentor and I had to figure out which Nino box to examine. "Boxes" are different regions. Each of these regions have numbers assigned to them. We decided to focus our research on the Nino 3.4 box because it gives good measures of changes in sea surface temperature. I have attached a picture of the Nino 3.4 box for clarity. Now since we restricted our study to the 3.4 box, we will only be analyzing the data in that specific region. I have downloaded data ranging back to 1870 and am excited to see what I will find!  These are my goals for each month.
September: Download and familiarize myself with mathematica, the program I will be using to conduct my experiment. Also, visit Dartmouth and meet my mentor in person to discuss my project goals. October: Gather information about El Niño. Learn more about air pressure, water temperature, and the effects El Niño has on the weather throughout the world. November: Start gathering data. Collect data all the way back from the 1800s about ENSO each year. December: Continue gathering data. January: Put all the data into mathematica. Create functions and graphs which make the data easier to analyze. February: Look for trends and try to figure out the data. This might take a while. March: Still working on figuring out the data. Hopefully by March I found something within the data. April: Work on my final presentation. May: Finalize my final presentation. I have always been interested in math and the various ways it connects to the real world. I always found math class interesting in school, but I was eager to learn practical applications for all the math I was learning. I talked to my family about this, since I have many mathematicians in my family, including my older brother. I decided last spring that the perfect way to learn more about the practical applications of math would be through a signature project. I reached out to the math department at Dartmouth which connected me with my current mentor, Kate. Kate talked to me about many different projects she was working on which all sounded very interesting. In the end, the project we decided to work on was analyzing weather patterns through data using a program called Mathmatica. We are starting off by looking at data of El Niño Southern Oscillation (ENSO). ENSO is an irregularly periodical variation in sea surface temperature, air pressure, and wind pressure over the tropical eastern Pacific Ocean. ENSO affects global warming, rainfall in various locations and can even trigger huge events such as the many hurricanes we have experiences this year. So far, there is not an effective way to predict ENSO in the future. Hopefully with the help of my mentor, I will be able to find a connection in order to predict ENSO in the following years which will give us much insight on the coming weather patterns throughout the world.
|
Archives
March 2018
Categories |
 RSS Feed
