|
This month, I am just researching hurricanes, and hurricane formation. I am looking to find some background information to put into my presentation. I am hoping to find some statistics on the hurricane season in 2017 I found out that the 2017 Atlantic hurricaine season was ranked as the 5th most active season since records began in 1851.There were 17 named storms, 10 hurricaines and 6 major hurricanes .In addition, it was by far the costliest season on record, with a total of at least $282.16 billion in damages. I also found some pictures of the hurricanes and the destruction left by the hurricanes which were really interesting.
0 Comments
As my project comes to a close, I am starting to think about the final presentation. I am basically done with all the researching aspect, so I am starting to think about what I want to talk about in my presentation and how to go about making it. I am also planning on how to manage my time and am giving myself certain deadlines for my presentation so I have plenty of time.
This month, I am just putting the final touches on my presentation. I spent time citing all my sources in APA format in my presentation.I also wrote a script in the notes of my presentation that I can read. Also, I have spent a lot of time rehearsing and running through my notes, to make sure my presentation is smooth. I had 2 practice presentations, and I think they went well so I am feeling prepared, even though I am a little nervous about presenting .
This week, I am really just focusing on making my presentation. The presentation needs to be a powerpoint that is about 15 minutes long. I have been trying to pick out a theme and font for my presentation. I also have been trying to put together some background information for my presentation , and pick out certain pictures which I want to include. My goal is to have most of my presentation done, so I won't have to rush and try to finish it last minute.
My signature presentation was on May 25th. This blog post will be about what it was like to present. I was actually quite nervous to present. I had practiced a lot and watched my practice video but presenting in front of lots of people can be really nerve wracking. My presentation was in the signature lab and about 50 people came. I was the first to go in my group. Although I was nervous to do it, once I got up and starting talking, I think my nerves went away. It was a lot easier than I expected, and I was really happy with how it turned out. After I was done presenting, I was really relieved and happy that I finished.
For this post, I will be moving on to discuss specific events that have occurred because of El Nino. This research will be useful to present at the end of the year to make my presentation more clear. I found out that El Niño led to the demise of many pre-Columbian Peruvian cultures such as the Moche. It is also rumored that El-Nino had such a strong effect in the 1780's, that it caused poor crop yields in Europe which impacted the French Revolution. The intense weather caused by El Nino in the 1870's caused some of the most deadly famines in the 19th century. A stand out was the 1876 famine in Northern China which killed approximately 13 million people. I was very surprised to learn about this because these random and unrelated world events were all impacted by the El Nino Weather patterns. For my next post, I plan to pick one more event which was impacted and look at it in closer detail.
This month, I have been moving a little slower than I hoped because I had the flu and was out of school for 10 days. However it hasn't set me back enormously because I was just planning on doing more research about the effects of the El Nino value on the weather. I don't have too much to report on, but hope to move quickly in March and spend some of spring break finalizing my research. Hopefully, I will also be able to start working on my end of year presentation, as the end of the year is quickly approaching and have more significant progress to update you on then.
As a next step in my project, I have been working on looking through some data my mentor sent me. She sent me an article about the difficulty of determining the relationship between seas surface temperature and the upcoming El Nino number. I have been exploring the phenomena that the article talks about and have been trying to find relationships between the consistently increasing/decreasing trends in the 3.4 index that occur in the months prior and an El Nino effect in November - January. I have been trying to see if there is one particularly predictive value. If there is, I am going to explore that relationship in great detail hoping to find some useful information that I can apply to the rest of my project.
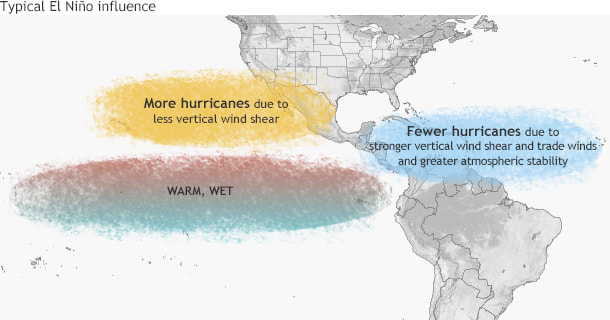
This month, I decided to take a break from looking at the mathematical side of El Nino, and decided to focus more on the actual weather. What do these data values mean? This entire project is focused on predicting El Nino values, so it is necessary to understand what the values mean in order to predict upcoming weather. I decided to start off by looking at El Nino's effect on temperature, considering temperature is a very basic measurement of the weather. The warm water boosts global air temperatures by a minimum of .1 degrees Celsius. This increase in temperature combined with global warming due to heat trapping gases such as carbon monoxide will result in 2017 being names one of the top 3 hottest years the earth has ever experienced. Next, I will research the direct relationship El Nino has on hurricanes and tropical storms, and hopefully be able to attempt to predict possible hurricane patterns in 2018.
|
Archives
March 2018
Categories |
 RSS Feed
